On Base Percentage Calculator - OBP Rate for Hitters
The on-base percentage calculator converts hits, walks, hit-by-pitches, at-bats, and sacrifice flies into a standard OBP line.
On Base Percentage Calculator
Results
What This Calculator Does
The on-base percentage calculator measures how often a batter reaches base through the events included in the standard OBP formula. It combines hits, walks, and hit-by-pitches in the numerator, then compares that total with at-bats, walks, hit-by-pitches, and sacrifice flies in the denominator. The result is displayed in the familiar baseball style, such as .370, and also as a percent for readers who want a plain rate.
The tool is useful when a box score, season log, player card, or youth-team stat sheet has the component counts but not the finished OBP. It also separates OBP from batting average, because a hitter can add offensive value by reaching base without recording a hit. A player with a modest batting average and many walks may still produce a strong OBP, while a player with few walks may show a smaller gap between average and OBP.
This calculator is limited to batter on-base percentage. It does not calculate slugging, OPS, weighted on-base average, stolen-base value, or run expectancy. Those measurements answer related but different questions. OBP focuses on reaching base, not total bases or the quality of each batted ball.
The distinction matters most when a report is being used for a baseball decision rather than a trivia check. A coach comparing two players may need to know whether a high batting average is supported by walks, or whether a low average is softened by a disciplined approach. A parent or scorekeeper may need to verify that a spreadsheet column was built from the proper denominator. A league administrator may need a neutral way to compare players from teams that record walks and hit-by-pitches consistently.
OBP can also help explain why two hitters with similar averages affect an inning differently. A hitter who records singles but rarely walks may depend heavily on batted-ball outcomes. A hitter who reaches on walks and hit-by-pitches creates more baserunner chances even during games without many hits. The calculator makes that difference visible without requiring a full scouting report. That separation is useful when a roster discussion needs evidence beyond the most familiar batting column.
For a broader slash-line check, batting average, OBP, slugging, and OPS should be reviewed from the same batting line. For a general rate review outside baseball, the Percentage Calculator can translate any part-to-whole relationship into percent form.
How the Calculator Works
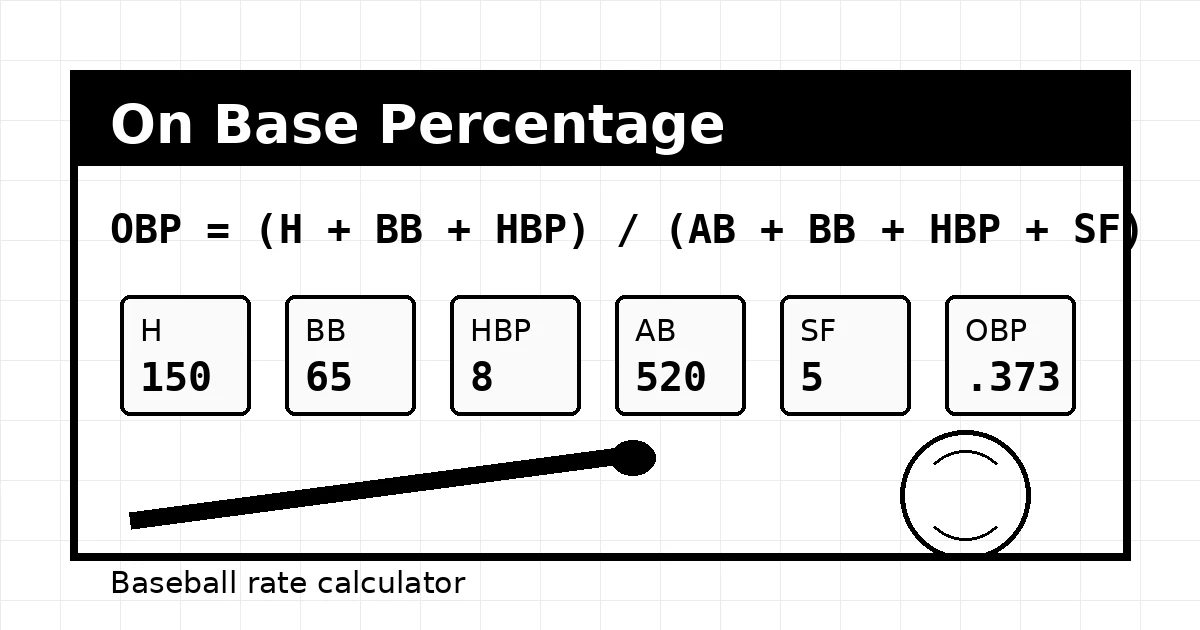
The OBP formula is direct: add hits, walks, and hit-by-pitches, then divide by at-bats plus walks plus hit-by-pitches plus sacrifice flies. In notation, it is:
The calculator keeps two totals visible. Times on base is the numerator, and the OBP denominator is the set of plate appearances counted by the formula. According to MLB's standard stats glossary, OBP measures how frequently a batter reaches base per plate appearance, excluding certain ways of reaching such as errors, fielder's choices, and dropped third strikes.
A 150-hit, 65-walk, 8-hit-by-pitch line over 520 at-bats and 5 sacrifice flies gives 223 times on base and a denominator of 598. Dividing 223 by 598 produces .3729, which is displayed as .373 in baseball notation. The percent row shows the same rate as 37.3%.
The numerator is intentionally narrow. Hits, walks, and hit-by-pitches are all credited because the batter is awarded or earns first base without requiring a fielding error. The denominator is wider because the calculation must account for the scoring chances where the batter did not reach base. At-bats cover hit and out outcomes, walks and hit-by-pitches add credited reaching events, and sacrifice flies add a plate appearance that can reduce the rate.
The calculator also reports batting average from the same hits and at-bats so the OBP gap can be inspected. The two rates share hits, but they do not share the same denominator. That is why a hitter with a .260 average and many walks can have a better OBP than a hitter with a .300 average and very few walks. The gap is often a quick signal of plate discipline, patience, or pitcher caution.
For comparing the numerator and denominator as a pure relationship, the Ratio Calculator can show the same counts as a simplified ratio beside the OBP rate.
Key Concepts Explained
Times on base
Hits, walks, and hit-by-pitches are credited in the OBP numerator because each event puts the batter on base under the formula.
Formula denominator
At-bats, walks, hit-by-pitches, and sacrifice flies form the denominator. This is not always identical to official plate appearances.
Sacrifice flies
Sacrifice flies lower OBP when the batter does not otherwise reach base, even though they can score a runner.
Baseball average format
Traditional baseball rates are shown to three decimal places without a leading zero, so 0.372 becomes .372.
The most common misunderstanding is treating OBP as a simple count of times a player stood on first base. The official calculation is narrower. Reaching on an error may matter tactically, but it is not credited in OBP. A fielder's choice may keep an inning alive, but it does not add to the numerator. Sacrifice bunts also do not appear in the standard formula.
Another useful distinction is plate appearance context. The calculator's denominator is not labeled as full plate appearances because some official plate appearance categories are outside the OBP formula. That wording avoids implying that every time at the plate belongs in the denominator. A complete stat report may include catcher interference, sacrifice bunts, or other events that need separate handling before an OBP calculation is checked.
The percent display should be treated as an interpretation aid rather than a replacement for baseball notation. A .375 OBP is the same mathematical rate as 37.5%, but baseball reports almost always use the three-decimal style. The calculator keeps both views available because the percent form is easier for some readers to understand, while the average-style result is easier to compare with scoreboards, player pages, and broadcast graphics.
When a team wants a companion contact metric, the Cricket Batting Average Calculator offers a useful contrast from another bat-and-ball sport where dismissals, runs, and innings are handled differently.
How to Use This Calculator
The entries should come from the same player, team, competition level, and date range. Mixing spring-training walks with regular-season at-bats, or combining tournament hits with league sacrifice flies, will create a rate that does not match any official report.
A clean workflow starts with the source scorebook or statistics export. Hits should be checked first because they drive both batting average and OBP. Walks and hit-by-pitches should then be reviewed against the game logs, since those events are easy to lose when a simple batting table only highlights at-bats and hits. Sacrifice flies deserve a separate check because they are less common but still affect the denominator.
If a stat sheet already lists plate appearances, it should not be pasted directly into the at-bats field. Plate appearances include categories that are not the same as at-bats, and OBP has its own denominator. The safest approach is to enter the component fields separately. When the calculator's denominator differs from a listed plate appearance total, the difference usually points to sacrifice bunts, catcher interference, or another category outside the standard OBP formula.
Enter hits from the batting line. Hits must already include singles, doubles, triples, and home runs.
Enter walks and hit-by-pitches. These values add to both the numerator and denominator.
Enter official at-bats, not plate appearances. Walks, sacrifice flies, and hit-by-pitches are separate fields.
Enter sacrifice flies. Leave the value at zero only when the scoring record confirms no sacrifice flies.
Review OBP, percent form, batting average, and the denominator to catch missing category entries.
For multi-player summaries where several OBP rates need a single descriptive value, the Average Percentage Calculator can help review separate rate values without changing the original box-score counts.
Benefits and When to Use It
OBP is valuable because run scoring starts with baserunners. A hitter who reaches base more often gives teammates more opportunities to advance runners, extend innings, and force pitchers to work from the stretch. The rate is especially helpful for leadoff hitters, patient hitters, and players whose value is not captured by hits alone.
- •Lineup planning: OBP helps identify hitters who create base traffic ahead of power bats.
- •Player development: Walks and hit-by-pitches can show plate-discipline value that batting average misses.
- •Stat-sheet checks: The denominator row can reveal when sacrifice flies or walks were omitted from a manual calculation.
- •Season comparisons: OBP can compare hitters with different batting averages when walk rates differ sharply.
The result should be read with context. A .360 OBP in a competitive adult league may describe a strong table-setter, while the same number in a youth league with many walks may require comparison with the league environment. The calculator reports the rate; roster decisions still need position, defense, age group, playing time, and competition quality.
OBP is also helpful when a player is returning from injury, changing levels, or adjusting to a different lineup role. A small drop in batting average may not be concerning if walk rate improves and OBP remains steady. A hot batting average may deserve caution if it is not supported by walks or hard contact. The calculator cannot judge swing quality, but it can keep the reaching-base rate visible while those baseball questions are considered.
For team planning, OBP often matters most near the top of the lineup. A high-OBP hitter before extra-base threats can increase RBI opportunities without needing to steal bases or hit for power. Lower in the lineup, OBP can still matter because extended innings create more plate appearances for the strongest hitters. In both cases, the rate should be paired with the player's role and the run-scoring shape of the team.
When the discussion involves a change from one season to another, the Percentage Change Calculator can describe how much a player's OBP moved between two periods.
Factors That Affect Results
Small scoring differences can change OBP, especially in short samples. A player with only twenty denominator events can move many points from one walk or sacrifice fly. A full season creates a steadier rate, but the calculation still depends on accurate component categories.
Scoring consistency
Errors, fielder's choices, and hits must be classified correctly before OBP is calculated. Mislabeling one play can alter both interpretation and the finished stat line.
Sacrifice fly records
Missing sacrifice flies usually makes OBP too high because the denominator is understated.
Sample size
Early-season or tournament samples can swing quickly. Longer periods usually give a more stable picture of reaching base.
Rule set
College, professional, and youth records may differ in scoring workflow, so the source stat sheet should be checked before combining entries.
As published in the NCAA baseball statistics manual, sacrifice flies are included for computing on-base percentage, while sacrifice bunts are excluded. That distinction is why the calculator asks for sacrifice flies but not sacrifice bunts.
Data quality is usually the largest practical factor. A single missing walk in a short high-school tournament can shift the displayed rate by several points. Over a long season, the same error may be less visible but still matters when awards, batting order decisions, or player evaluations are close. The denominator row is included to make these checks easier, because an unexpected denominator often reveals an input mismatch before the final OBP is trusted.
The result can also be distorted when different competitions are combined without context. A player may face different pitching quality in league play, tournament play, showcases, and fall games. Combining all events into one OBP is mathematically valid if the counts are accurate, but the interpretation changes. A split by competition or month can sometimes explain development better than one blended season total.
Historical comparisons need the same caution. OBP from wood-bat leagues, metal-bat leagues, professional seasons, and youth schedules can be calculated with the same formula, but run environments and scoring standards may differ. The number is most useful when the comparison group is clear.
For interpreting point changes in a three-decimal baseball rate, the Percentage Point Calculator can clarify the difference between points and relative percent movement.
Frequently Asked Questions
Q: How is on-base percentage calculated?
A: On-base percentage is calculated as hits plus walks plus hit-by-pitches divided by at-bats plus walks plus hit-by-pitches plus sacrifice flies. The result is usually displayed as a three-decimal baseball rate.
Q: Do errors count toward OBP?
A: Reaching base on an error is not included in the standard OBP numerator. The event may put the batter on base in the game, but it is excluded from the official rate calculation.
Q: Why are sacrifice flies included in OBP?
A: Sacrifice flies are included in the denominator because they are plate appearances that can lower OBP. Sacrifice bunts are excluded from the standard OBP formula used by MLB and NCAA scoring references.
Q: Is OBP the same as batting average?
A: OBP is broader than batting average. Batting average uses hits divided by at-bats, while OBP also credits walks and hit-by-pitches and includes sacrifice flies in the denominator.
Q: What does a .400 OBP mean?
A: A .400 OBP means the batter reaches base in 40 percent of the plate appearances covered by the OBP formula. It is written as .400 rather than 40.0% in traditional baseball stat lines.
Q: Can OBP be lower than batting average?
A: Yes. OBP can be lower than batting average when a batter has few walks or hit-by-pitches and enough sacrifice flies to expand the OBP denominator beyond the hit-based numerator.